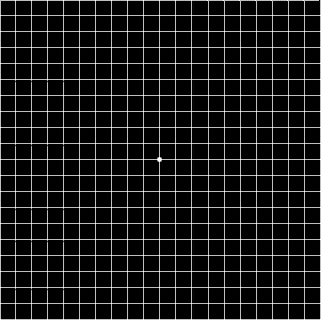
Test one eye at a time. Cover the other eye with an eye patch. You can make an eye patch by simply folding and with a piece of tissue paper.
Look at the chart projected on the screen at a close reading distance of about 36cm (14 inches).
Wear your reading glasses to do the test if you need them.
Focus your gaze at the prominent white dot in the centre of the chart.

Now answer the following questions: [Remember throughout the test to keep your gaze fixed at the white dot.]
- Can the white dot in the center be clearly seen?
- If your answer is “yes”, move on to question no. 3. If your answer is “no, but I can see it if I glanced aside”, it means that you have a central blind spot.
- Can you see the four corners of the chart without shifting your gaze? If your answer is “yes”, move on to question no. 4. If your answer is “no, one corner is cut off” or “part of one side is missing”, it means that you have a defect in your central visual field.
- Do you see the whole grid pattern of lines as intact? In other words, are all the lines straight with no interruption, distortion or missing small squares?
Interpreting The Results
If you answer “yes” to all three questions, your central visual function is normal and you do not suffer from any central vision disorder. If your answer is “no” to any of the above questions, you have a defect in your central vision and you should consult an eye doctor. Print a copy of the chart and use a pencil to mark out the nature and extent of any abnormality. This will help indicate the extent of abnormality to your eye doctor and will also help as a means of monitoring any changes.

Understanding More About The Central Vision Disorder Test
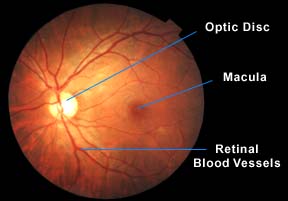
This test enables early detection of diseases affecting your central visual field or in other words, the macula that is the center part of your retina. For those with existing macula diseases, it can be used to monitor any improvement or deterioration of their condition.

It requires you to look at a special diagram called the Amsler Chart. This is essentially a large square with multiple horizontal and vertical lines dividing it into a finely squared grid pattern with a prominent center spot. The dimensions of the squares are calculated such that, when viewed at the correct reading distance, they will project a grid pattern of straight lines and squares over the entire macula region of your retina and the viewer will correspondingly perceive a likewise pattern.
Any disease affecting the macula will cause a disturbance to this grid pattern. This may present as blurred or distorted lines, dark blind spots or missing squares (scotomas). In this way the Amsler chart is able to detect as well as monitor the progression of diseases affecting the macula.

